Faire un triangle de Pascal coloré en Python est un bon moyen de s’occuper alors que les vacances sont là. Je vais vous présenter plusieurs designs, mon préféré allant au dernier.
Alors oui, je sais, j’avais déjà proposé une méthode pour construire le triangle de Pascal dans ce post. Mais j’avais envie d’explorer de nouvelles contrées informatiques. Je ne voulais pas passer par \(\LaTeX\).
Un triangle de Pascal coloré en Python: les prémices
Faire un triangle de Pascal en Python, c’est pas trop compliqué. Mais rendre le résultat attrayant, joli, et donc en mode graphique, c’est mieux… Il y a plusieurs techniques:
- pygame (pas génial à mon goût),
- tkinter (beurk! pour si peu ?)
- via \(\LaTeX\) et TiKZ (mouais… mais bon! je veux éviter justement!)
- matplotlib… Ouais!
On va partir sur matplotlib!
Le cahier des charges est simple:
- un triangle de Pascal centré ou pas
- des couleurs de fond pour chaque « cases »
- des couleurs en fonction de la position du nombre par rapport au centre des lignes
- une sauvegarde en haute définition de l’image.
Je précise que je ne vais pas définir ce qu’est le triangle de Pascal: z’avez cas regarder sur wikipedia.
Un triangle de Pascal coloré en Python: les différentes propositions
Je vais vous présenter six scripts.
Un triangle de Pascal coloré en Python: script 1
import numpy as np
import matplotlib.pyplot as plt
import matplotlib.colors as mcolors

def pascal_triangle(n):
    """Generate the first n rows of Pascal's triangle."""
    triangle = np.zeros((n, n), dtype=int)
    for i in range(n):
        triangle[i, 0] = 1
        for j in range(1, i + 1):
            triangle[i, j] = triangle[i - 1, j - 1] + triangle[i - 1, j]
    return triangle

def plot_pascal_triangle(n):
    """Plot the first n rows of Pascal's triangle with color."""
    triangle = pascal_triangle(n)

    fig, ax = plt.subplots(figsize=(10, 10))
    ax.axis('off')

    # Define a color map
    colors = plt.cm.viridis(np.linspace(0, 1, n))

    for i in range(n):
        for j in range(i + 1):
            x = i
            y = -i / 2 + j
            color = colors[i]
            intensity = 1 - abs(j - i / 2) / (i / 2 + 1)
            ax.text(y, -x, triangle[i, j], ha='center', va='center',
                    bbox=dict(facecolor=color * intensity, edgecolor='none', boxstyle='round,pad=0.3'))

    plt.xlim(-n/2, n/2)
    plt.ylim(-n, 1)
    plt.gca().set_aspect('equal', adjustable='box')
    plt.savefig('triangle_de_pascal.png', dpi=300, bbox_inches='tight')
    plt.show()

plot_pascal_triangle(10)
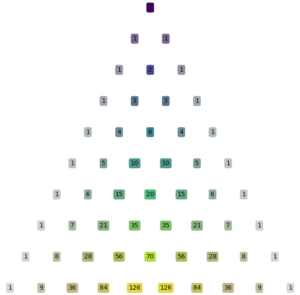
Bon, clairement, c’est joli mais pas ouf… On peut améliorer!
Script 2: cases carrées, triangle aligné à gauche
import numpy as np
import matplotlib.pyplot as plt

def pascal_triangle(n):
    """Generate the first n rows of Pascal's triangle."""
    triangle = np.zeros((n, n), dtype=int)
    for i in range(n):
        triangle[i, 0] = 1
        for j in range(1, i + 1):
            triangle[i, j] = triangle[i - 1, j - 1] + triangle[i - 1, j]
    return triangle

def plot_pascal_triangle(n):
    """Plot the first n rows of Pascal's triangle with color."""
    triangle = pascal_triangle(n)

    fig, ax = plt.subplots(figsize=(10, 10))
    ax.axis('off')

    # Define a color map
    colors = plt.cm.viridis(np.linspace(0, 1, n))

    max_width = max([len(str(triangle[i, j])) for i in range(n) for j in range(i + 1)])

    for i in range(n):
        for j in range(i + 1):
            x = j
            y = -i
            color = colors[i]
            intensity = 1 - abs(j - i / 2) / (i / 2 + 1)
            rect = plt.Rectangle((x - 0.5, y - 0.5), 1, 1, facecolor=color * intensity, edgecolor='none')
            ax.add_patch(rect)
            ax.text(x, y, triangle[i, j], ha='center', va='center', fontsize=10)

    plt.xlim(-0.5, n - 0.5)
    plt.ylim(-n, 0.5)
    plt.gca().set_aspect('equal', adjustable='box')
    plt.savefig('triangle_de_pascal.png', dpi=300, bbox_inches='tight')
    plt.show()

plot_pascal_triangle(10)
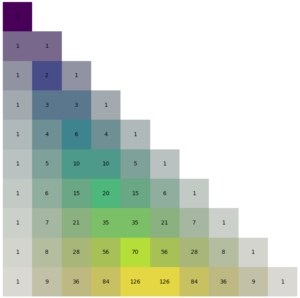
Cela commence à avoir de la gueule… Mais j’aime bien quand c’est centré!
Script 3: cases carrées, triangle centré
import numpy as np
import matplotlib.pyplot as plt

def pascal_triangle(n):
    """Generate the first n rows of Pascal's triangle."""
    triangle = np.zeros((n, n), dtype=int)
    for i in range(n):
        triangle[i, 0] = 1
        for j in range(1, i + 1):
            triangle[i, j] = triangle[i - 1, j - 1] + triangle[i - 1, j]
    return triangle

def plot_pascal_triangle(n):
    """Plot the first n rows of Pascal's triangle with color."""
    triangle = pascal_triangle(n)

    fig, ax = plt.subplots(figsize=(10, 10))
    ax.axis('off')

    # Define a color map
    colors = plt.cm.viridis(np.linspace(0, 1, n))

    for i in range(n):
        for j in range(i + 1):
            x = j - i / 2
            y = -i
            color = colors[i]
            intensity = 1 - abs(j - i / 2) / (i / 2 + 1)
            rect = plt.Rectangle((x - 0.5, y - 0.5), 1, 1, facecolor=color * intensity, edgecolor='none')
            ax.add_patch(rect)
            ax.text(x, y, triangle[i, j], ha='center', va='center', fontsize=10)

    plt.xlim(-n/2 - 0.5, n/2 + 0.5)
    plt.ylim(-n, 0.5)
    plt.gca().set_aspect('equal', adjustable='box')
    plt.savefig('triangle_de_pascal.png', dpi=300, bbox_inches='tight')
    plt.show()

plot_pascal_triangle(10)
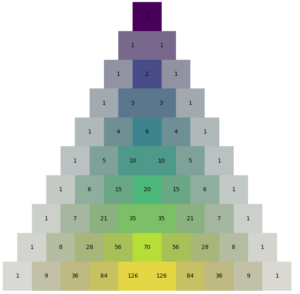
Voilà! C’est centré, mais peut-être trop « carré » ! Non ?
Script 4: cases avec coins arrondis, cases qui se chevauchent
import numpy as np
import matplotlib.pyplot as plt
from matplotlib.patches import FancyBboxPatch

def pascal_triangle(n):
    """Generate the first n rows of Pascal's triangle."""
    triangle = np.zeros((n, n), dtype=int)
    for i in range(n):
        triangle[i, 0] = 1
        for j in range(1, i + 1):
            triangle[i, j] = triangle[i - 1, j - 1] + triangle[i - 1, j]
    return triangle

def plot_pascal_triangle(n):
    """Plot the first n rows of Pascal's triangle with color."""
    triangle = pascal_triangle(n)

    fig, ax = plt.subplots(figsize=(10, 10))
    ax.axis('off')

    # Define a color map
    colors = plt.cm.viridis(np.linspace(0, 1, n))

    for i in range(n):
        for j in range(i + 1):
            x = j - i / 2
            y = -i
            color = colors[i]
            intensity = 1 - abs(j - i / 2) / (i / 2 + 1)
            rect = FancyBboxPatch((x - 0.5, y - 0.5), 1, 1,
                                  boxstyle="round,pad=0.1,rounding_size=0.2",
                                  facecolor=color * intensity, edgecolor='none')
            ax.add_patch(rect)
            ax.text(x, y, triangle[i, j], ha='center', va='center', fontsize=10, color='white')

    plt.xlim(-n/2 - 0.5, n/2 + 0.5)
    plt.ylim(-n, 0.5)
    plt.gca().set_aspect('equal', adjustable='box')
    plt.savefig('triangle_de_pascal.png', dpi=300, bbox_inches='tight')
    plt.show()

plot_pascal_triangle(10)
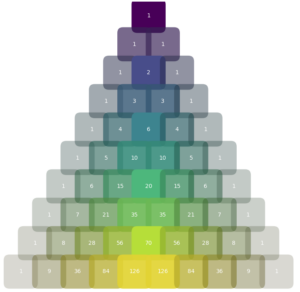
Script 5: cases à coins arrondis, nombres qui s’adaptent
import numpy as np
import matplotlib.pyplot as plt
from matplotlib.patches import FancyBboxPatch

def pascal_triangle(n):
    """Generate the first n rows of Pascal's triangle."""
    triangle = np.zeros((n, n), dtype=int)
    for i in range(n):
        triangle[i, 0] = 1
        for j in range(1, i + 1):
            triangle[i, j] = triangle[i - 1, j - 1] + triangle[i - 1, j]
    return triangle

def plot_pascal_triangle(n):
    """Plot the first n rows of Pascal's triangle with color."""
    triangle = pascal_triangle(n)

    fig, ax = plt.subplots(figsize=(10, 10))
    ax.axis('off')

    # Define a color map
    colors = plt.cm.viridis(np.linspace(0, 1, n))

    box_width = 0.8
    box_height = 0.8
    rounding_size = 0.1

    base_fontsize = 12  # Max font size

    for i in range(n):
        for j in range(i + 1):
            x = j - i / 2
            y = -i
            color = colors[i]
            intensity = 1 - abs(j - i / 2) / (i / 2 + 1)
            rect = FancyBboxPatch((x - box_width / 2, y - box_height / 2), box_width, box_height,
                                  boxstyle=f"round,pad=0.1,rounding_size={rounding_size}",
                                  facecolor=color * intensity, edgecolor='none')
            ax.add_patch(rect)

            # Adjust font size based on number length
            number_str = str(triangle[i, j])
            fontsize = min(base_fontsize, box_width * 30 / len(number_str))
            ax.text(x, y, number_str, ha='center', va='center', fontsize=fontsize, color='white')

    plt.xlim(-n/2 - 1, n/2 + 1)
    plt.ylim(-n, 1)
    plt.gca().set_aspect('equal', adjustable='box')
    plt.savefig('triangle_de_pascal.png', dpi=300, bbox_inches='tight')
    plt.show()

plot_pascal_triangle(10)
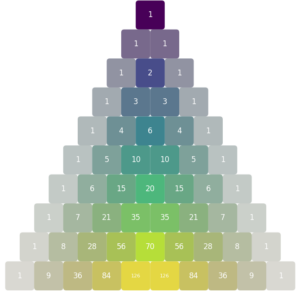
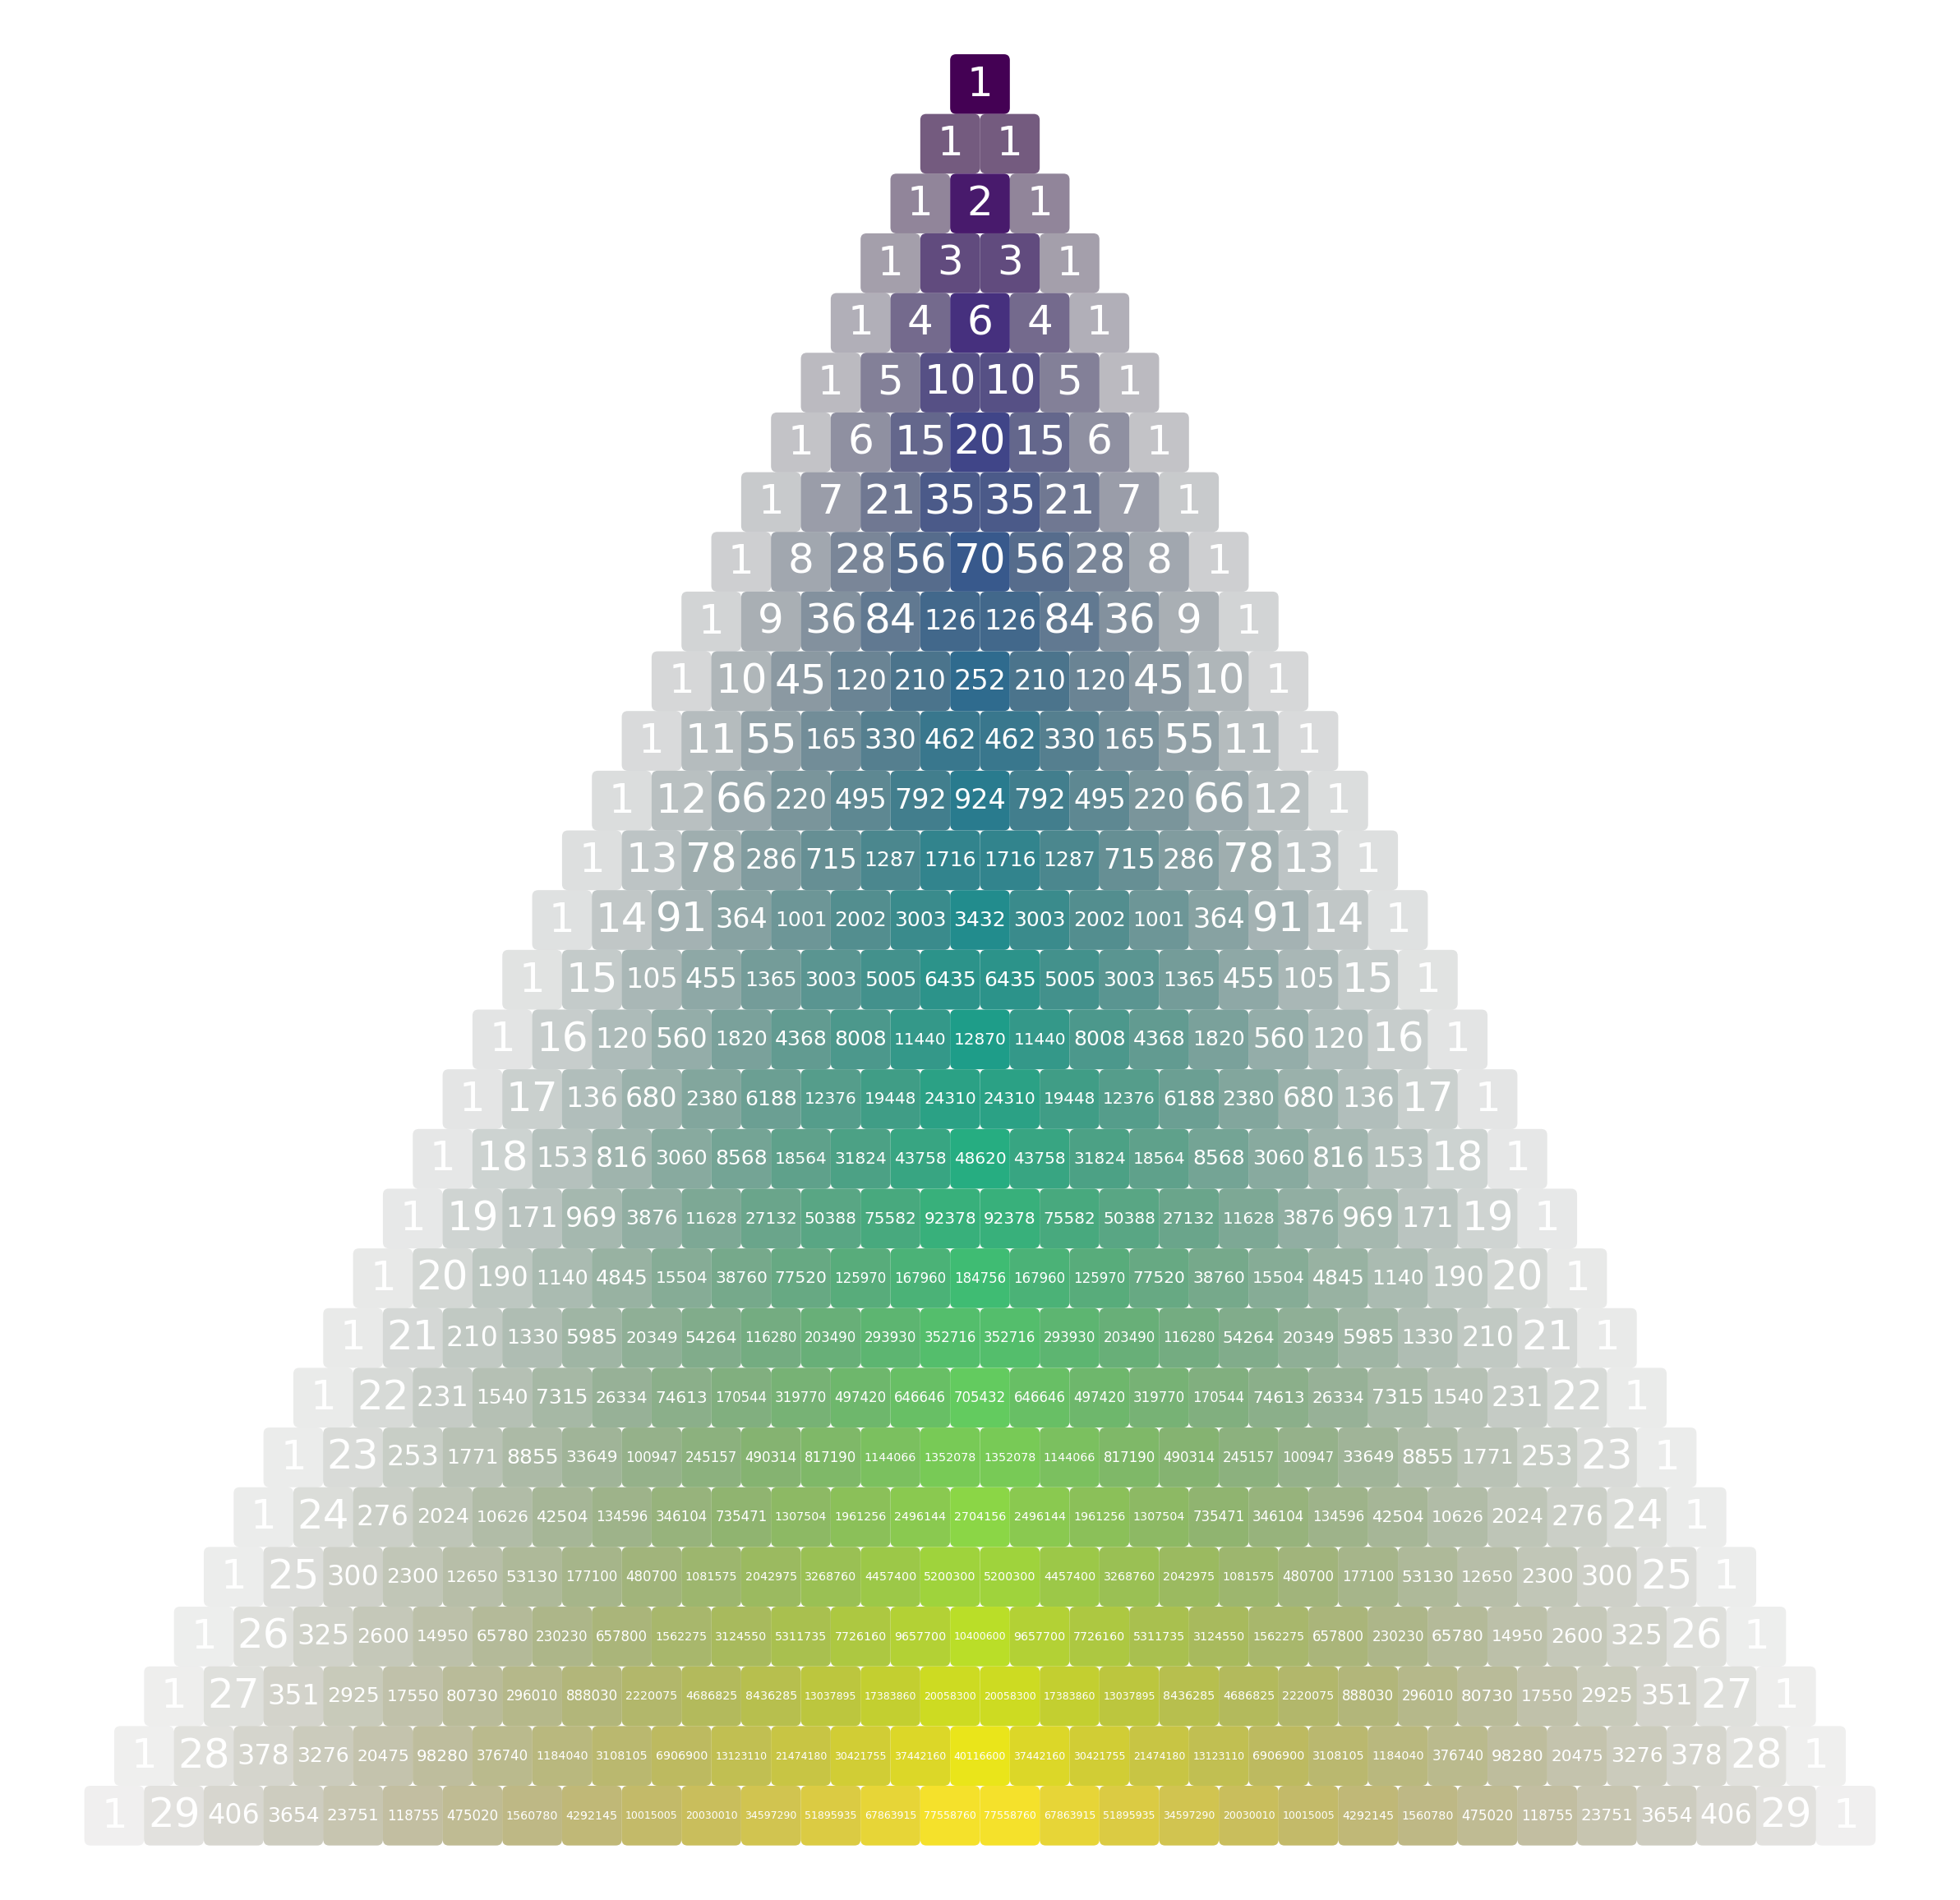
L’avantage de ce dernier code est que la taille des nombres s’adapte. Voici ce que donne l’image lorsque n = 30: